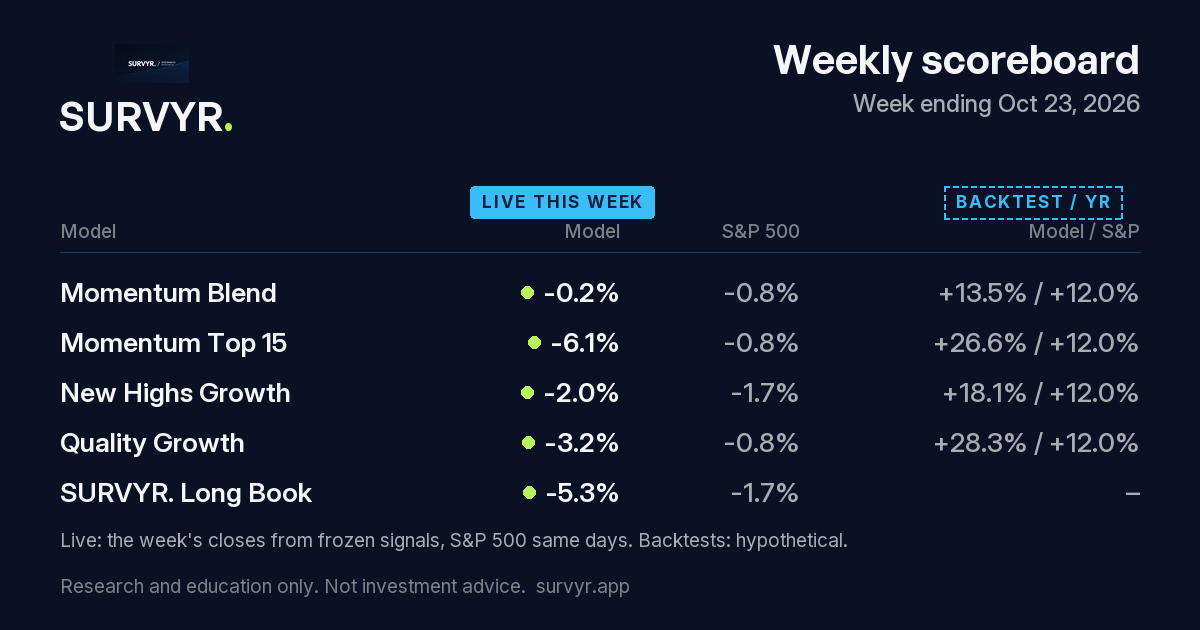
Scoreboard
Week ending Oct 23, 2026
Each live model's week against the S&P 500, from signals frozen before the week began. Recorded every Friday after the close.
Momentum Blend was down 0.2%, while the S&P 500 was down 0.8% that week. That is 0.6 points ahead.
Momentum Top 15 was down 6.1%, while the S&P 500 was down 0.8% that week. That is 5.2 points behind.
New Highs Growth was down 2.0%, while the S&P 500 was down 1.7% that week. That is 0.3 points behind.
Quality Growth was down 3.2%, while the S&P 500 was down 0.8% that week. That is 2.4 points behind.
SURVYR. Long Book was down 5.3%, while the S&P 500 was down 1.7% that week. That is 3.6 points behind.
Models are listed by name, not by result. This is a record of a research model, not advice, and no one's money is in it.
Live Live
| Model | Week | S&P 500 | Difference | Since live | S&P 500 |
|---|---|---|---|---|---|
| Momentum Blend live from the Oct 19, 2026 close | -0.2% | -0.8% | +0.6% | -0.2% | -0.8% |
| Momentum Top 15 live from the Oct 19, 2026 close | -6.1% | -0.8% | -5.2% | -6.1% | -0.8% |
| New Highs Growth live from the Oct 21, 2026 close | -2.0% | -1.7% | -0.3% | -2.0% | -1.7% |
| Quality Growth live from the Oct 19, 2026 close | -3.2% | -0.8% | -2.4% | -3.2% | -0.8% |
| SURVYR. Long Book live from the Oct 21, 2026 close | -5.3% | -1.7% | -3.6% | -5.3% | -1.7% |
Closes through Oct 23, 2026. A model's first week counts from its first live close. Price-only, before costs and taxes; entry prices are the first close after each signal was frozen.
Share card
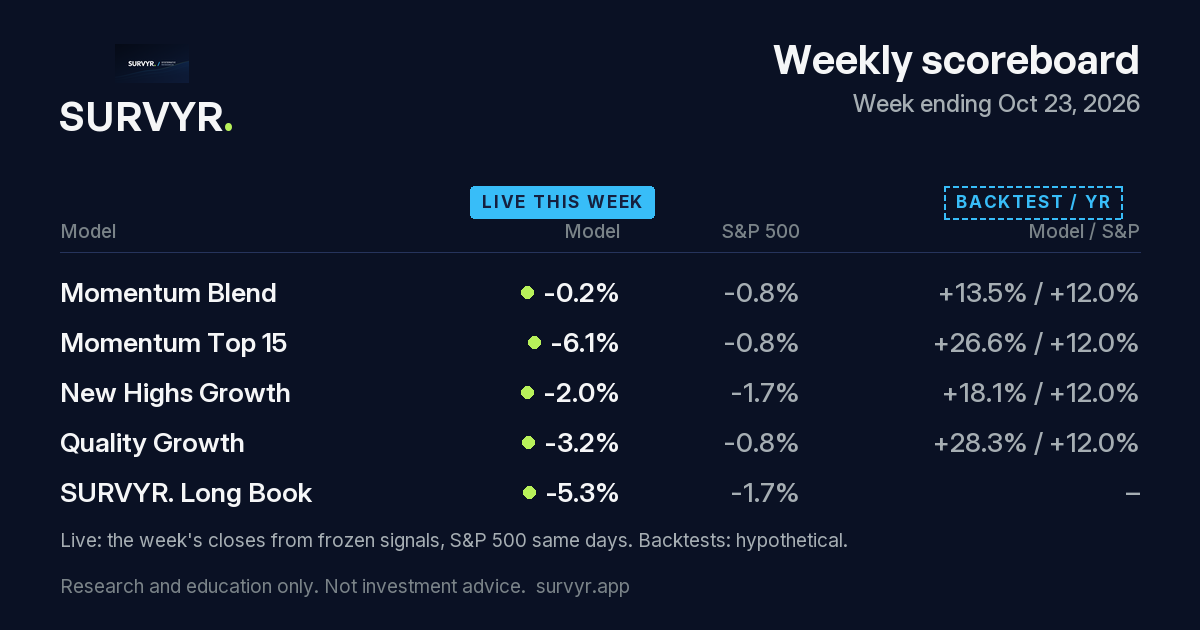
Built by the Friday job. Link: https://survyr.app/scoreboard/2026-10-23.png · latest always at /scoreboard/card.png
Backtests, kept apart Backtest
These are simulations of the same rules on past data. They are not live results and never enter the table above.
| Model | Per year | S&P 500 |
|---|---|---|
| Momentum Blend | +13.5% | +12.0% |
| Momentum Top 15 | +26.6% | +12.0% |
| New Highs Growth | +18.1% | +12.0% |
| Quality Growth | +28.3% | +12.0% |
| SURVYR. Barbell Momentum & T-Bill Shield | +20.1% | +12.0% |
| SURVYR. Physical AI Grid & Power | +38.4% | +12.0% |
Out-of-sample 2022-01 – 2026-09, after trading costs. Hypothetical.
Raw weekly closes (JSON) · Track record and hash chain
SURVYR. publishes research and model portfolios for information and education. It does not take clients, hold money or give investment advice. Past results don't predict future returns. Important disclosures
Get the market emails
Morning Brief (8 AM ET) & Market Close (4:30 PM ET), weekdaysIndexes, sectors, biggest movers, rates, top news, SURVYR. model changes and what's ahead. Free, two short emails each weekday.
Check your inbox to confirm
We sent a link to . Tap it to start your emails. Nothing is sent until you confirm.
Not there in a minute? Check spam, or .
Dev mode No email provider here, so the confirm link is shown: Open confirm link
Free to use. No card, no ads, no auto-renew.
Systematic research · Not investment advice · Hypothetical unless marked Live · Data: Yahoo Finance (15-min delayed), SEC EDGAR, House Clerk · Important disclosures · Contact desk@coteau.app
Coteau 0.9 · Oct 21, 2026